Histograms are considered a basic element of multiple image and signals processing techniques. The histogram level information can be of great importance for different image enhancement techniques. Multiple image segmentation and compression based applications can be designed by utilizing the information inherent in image histograms. Figure 1 shows a sample colored image along with the three channel histograms providing information regarding pixel intensity values along R, G and B channel.
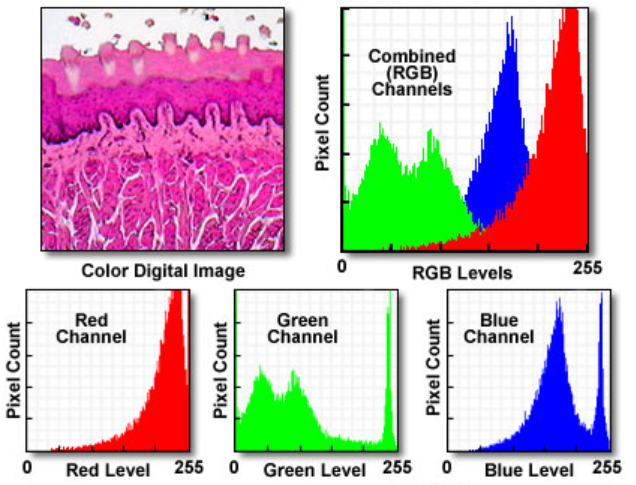
Figure 1. Example histograms presenting Colored image information 1
Histogram Equalization is considered to be the most powerful tool in the area of image contrast enhancement and is the most commonly used method due to its simplicity and highest efficiency for most of the cases. The histogram of a colored image is presented as separate histograms for each color channel but histogram equalization cannot be applied on each channel because it dramatically affects the color balance of an image, that’s why the colored image is converted into another color space such as HSV and after that, histogram equalization is applied on the value channel without affecting anything in the other two channels. 2 Mostly it is applied on gray scale images. It is a common observation in terms of image intensity values that the components of a histogram in case of a dark image lie more towards the low intensity values as shown in Figure 2.
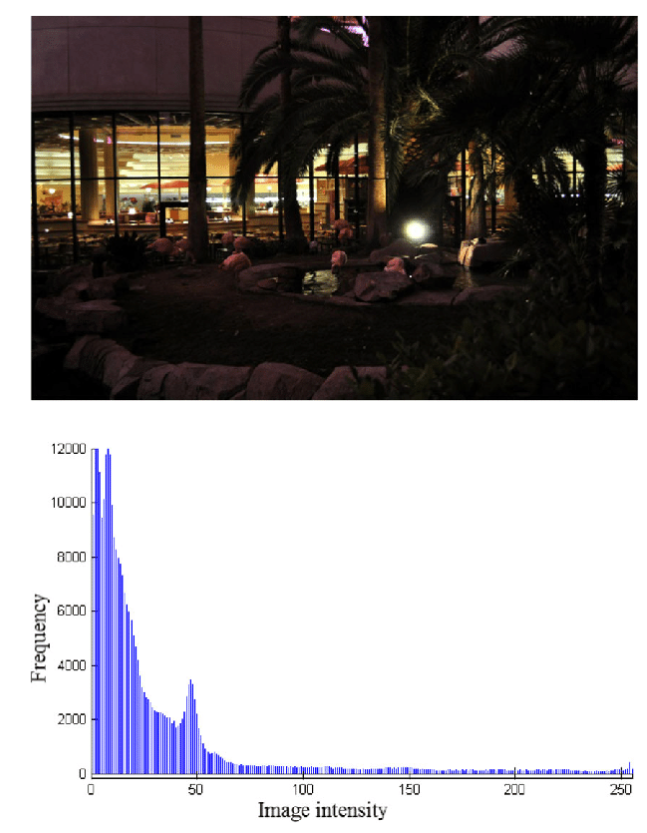
Figure 2. Dark Image (Top), Histogram of dark image (Bottom) 3
The image having low contrast tends to have a much narrow histogram comprising of middle intensity values which gives a dull washed out look in the case of a monochrome image while a high contrast image is comprised of a wide range of intensity values where the gap between intensity values is of uniform quality and has got a very few high intensity values as compared to the rest of the values as shown in Figure 3.
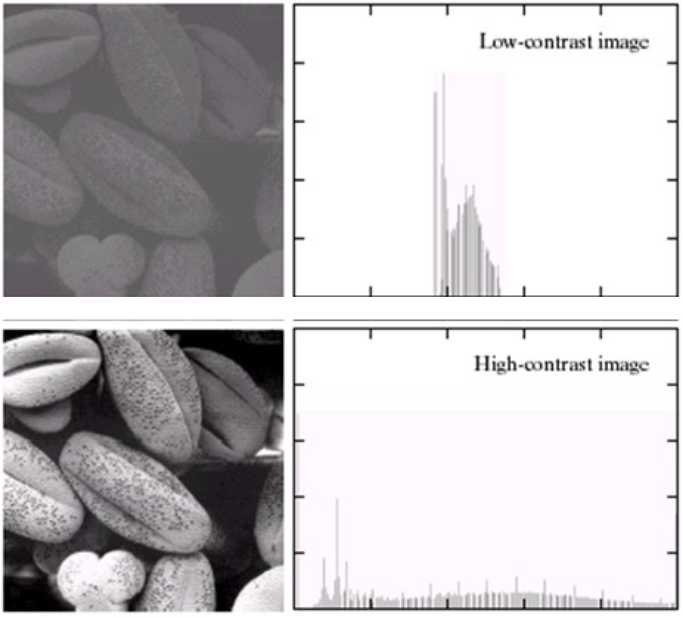
Figure 3. Low Contrast Image and Histogram example (Top Row), High Contrast Image and Histogram example (Bottom Row). 4
Contrast enhancement of images is performed by adjusting the intensity distribution of an image through its cumulative distribution function to convert the image under consideration into a uniform intensity distribution image. The usage of two kinds of transformation functions classifies histogram equalization into two types: one is global histogram equalization (GHE) and second is local histogram equalization (LHE). GHE uses the complete input image for the computation of transformation function which results in the stretchiness and flatness of dynamic range of the histogram to improve the overall contrast of an image. While LHE applies transformations on specific areas of an image which can sometimes make the overall look of image unacceptable. 5 Figure 4 shows the comparison of resultant images after applying global and local histogram equalization methods. Most prominent application areas of Histogram Equalization include speech recognition systems, medical image segmentation and processing applications and texture synthesis applications.
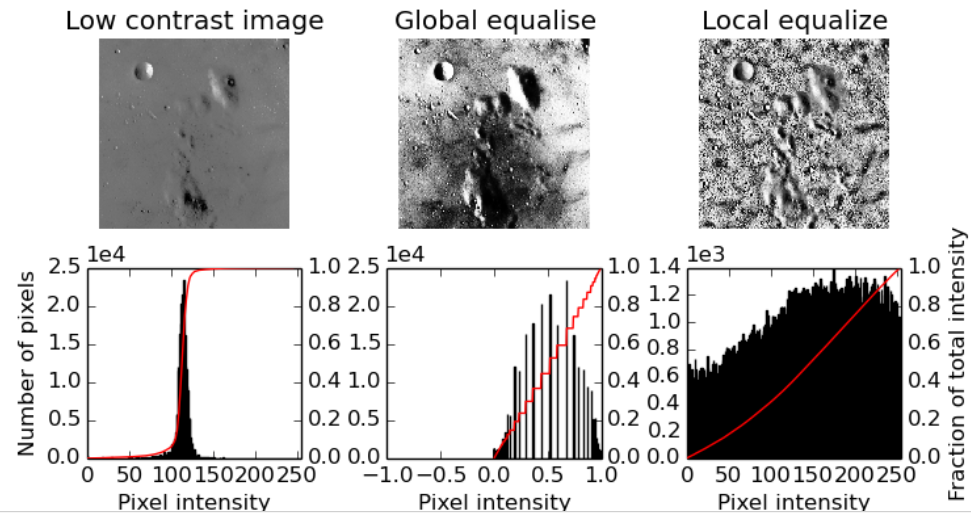
Figure 4. Results of Global and Local Histogram Equalization methods. 6
Adaptive histogram equalization is another refined form of histogram equalization method, in which multiple histograms are computed for different parts of an image and equalization is performed on each histogram separately to create a high quality adjustment locally in an image. Figure 5 shows the difference between ordinary histogram equalization and adaptive histogram equalization results. This kind of equalization is preferred mostly in the cases where the image is consisted of different objects which require separate adjustments.
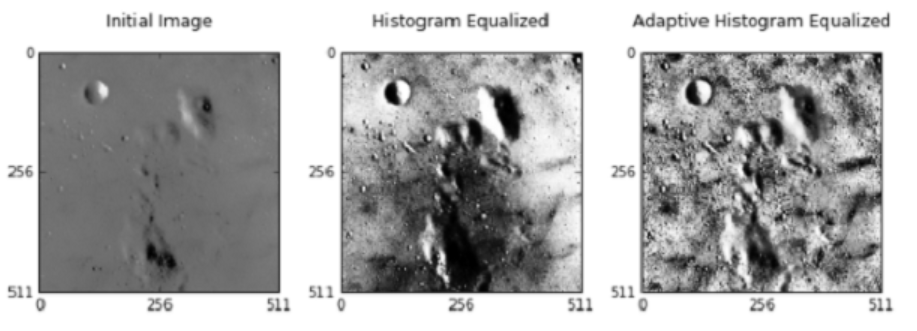
Figure 5. Ordinary and Adaptive histogram equalization results. 2
There are two main disadvantages of histogram equalization method whose efficiency is reduced for some applications:
- It applies same gray level to two different neighboring gray levels having different intensity levels.
- In the case where most part of an image has got same gray level; histogram equalization applies a gray level of higher intensity to all that area resulting in washed out effect on the image. 7
References
-
HAMAMATSU, http://hamamatsu.magnet.fsu.edu/articles/digitalimagebasics.html (March 2021). ↩
-
Towardsdatascience, https://towardsdatascience.com/histogram-equalization-5d1013626e64 (March 2021). ↩ ↩2
-
Hussain, Khalid & Rahman, Shanto & Rahman, Md. Mostafijur & Shah, Khaled & Abdullah-Al-Wadud, M. & Khan, Muhammad & Shoyaib, Mohammad. (2018). A histogram specification technique for dark image enhancement using a local transformation method. IPSJ Transactions on Computer Vision and Applications. 10. 10.1186/s41074-018-0040-0. ↩
-
SlidePlayer, https://slideplayer.com/slide/4511969/ (March 2021). ↩
-
Zhu, H., Chan, F. H., & Lam, F. K. (1999). Image contrast enhancement by constrained local histogram equalization. Computer vision and image understanding, 73(2), 281-290. ↩
-
scikit-image, https://scikit-image.org/docs/0.9.x/auto_examples/plot_local_equalize.html (March 2021). ↩
-
Raj, S., Kumar, S., & Raj, S. (2015). An Improved Histogram Equalization Technique for Image Contrast Enhancement. ResearchGate, January. ↩